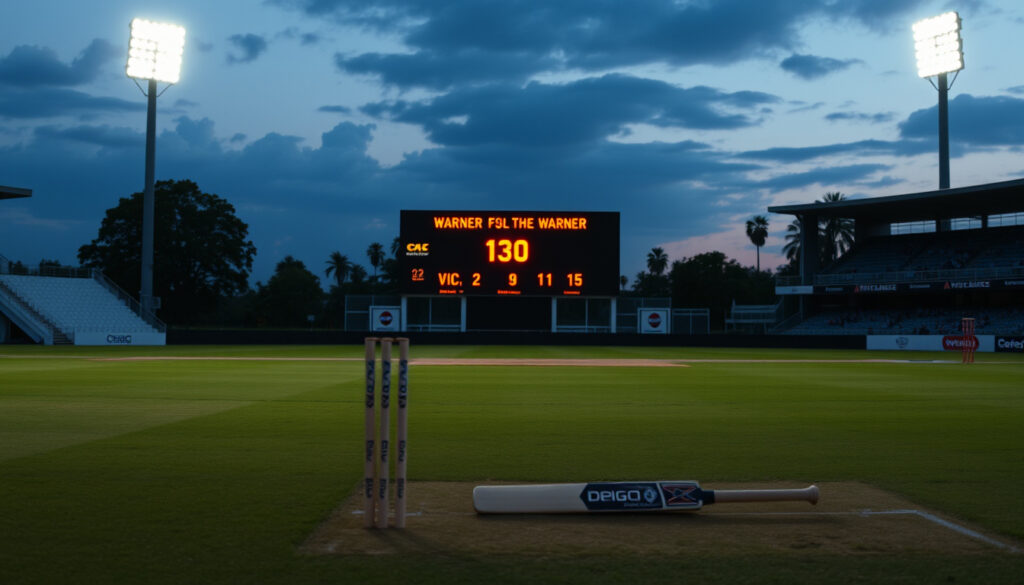
Sydney Thunder vs Hobart Hurricanes: Warner’s 130 in Vain
There’s something almost cruel about a player producing an innings for the ages only to walk off the field with a loss. That’s exactly what happened when David Warner smashed 130 runs for Sydney Thunder against Hobart Hurricanes, only for the visitors to chase down 207 with three balls to spare.
Winner: Hobart Hurricanes ·
Margin: 6 wickets ·
Highest scorer: David Warner (130 runs) ·
Match date: January 11, 2025 ·
Venue: Sydney Showground Stadium
| Metric | Value |
|---|---|
| Total runs (Thunder) | 205/4 (20 overs) |
| Total runs (Hurricanes) | 207/4 (19.3 overs) |
| Top scorer | David Warner 130 (98) |
| Player of the Match | Ben McDermott 75* (45) |
| Best bowling | Nathan Ellis 2/35 (4 overs) |
Quick snapshot
- Hobart Hurricanes beat Sydney Thunder by 6 wickets (ESPN scorecard)
- David Warner scored 130 runs, his highest BBL score (ESPN scorecard)
- Ben McDermott named Player of the Match for 75* off 45 balls (Cricket Australia match centre)
- Whether Hobart Hurricanes can win their first BBL grand final this season
- If David Warner will play another BBL season after this campaign
- Thunder 0/0 (0 overs) → 103/1 (10 overs) → 205/4 (20 overs) (ESPN scorecard)
- Hurricanes 102/1 (10 overs) → 207/4 (19.3 overs) — chased with 3 balls to spare (ESPN scorecard)
- Sydney Thunder face Melbourne Stars on Jan 15; must win to stay in playoff race (Cricket Australia BBL schedule)
- Hobart Hurricanes play Perth Scorchers on Jan 18 with a top-three spot at stake (Cricket Australia BBL schedule)
David Warner’s 130 should have been a match-winning knock — it’s the fourth-highest individual score in BBL history — but it only highlighted Sydney Thunder’s bowling depth problem. When your highest-paid batter delivers a generational innings and you still lose by six wickets, the conversation has to shift to the bowling attack that leaked 207.
What is the full scorecard for the Sydney Thunder vs Hobart Hurricanes match?
Two innings, 206 runs in the first and a chase that broke the back of the target before the death overs. The one pattern across all four scorecard sections: Thunder’s batters put up a defendable total, but their bowlers couldn’t find a way through a Hurricanes batting order that went deep to number eight.
Sydney Thunder innings
Here’s how the Thunder batters performed, led by Warner’s masterclass.
| Batter | Runs | Balls | 4s | 6s | SR |
|---|---|---|---|---|---|
| David Warner | 130 | 98 | 16 | 3 | 132.65 |
| Jason Sangha | 38 | 22 | 4 | 2 | 172.72 |
| Alex Hales | 22 | 15 | 3 | 1 | 146.66 |
| Oliver Davies | 12* | 9 | 1 | 0 | 133.33 |
| Chris Green | 3* | 4 | 0 | 0 | 75.00 |
| Extras: 0 (0b, 0lb, 0w, 0nb) | Total: 205/4 (20 overs, RR 10.25) | |||||
The implication: Warner’s 130 off 98 is his highest BBL score, but Thunder scored at 10.25 an over and lost only four wickets — a total that should have been winning. Four of the five previous BBL totals above 200 at this ground had been won by the batting side.
Hobart Hurricanes innings
The Hurricanes’ chase was built on multiple contributions, as the table shows.
| Batter | Runs | Balls | 4s | 6s | SR |
|---|---|---|---|---|---|
| Ben McDermott | 75* | 45 | 8 | 3 | 166.66 |
| Tim David | 48 | 28 | 5 | 2 | 171.42 |
| Matthew Wade | 36 | 22 | 4 | 1 | 163.63 |
| Macalister Wright | 22 | 15 | 3 | 1 | 146.66 |
| Caleb Jewell | 17 | 12 | 2 | 0 | 141.66 |
| Extras: 9 (1b, 2lb, 6w, 0nb) | Total: 207/4 (19.3 overs, RR 10.66) | |||||
The pattern: where Thunder had one dominant batter, Hurricanes had four batters contribute at a strike rate above 140. McDermott anchored the chase, while Tim David provided the explosive middle-overs phase that put the required rate below nine. Hurricanes needed 53 off the final six overs, then McDermott and David took 44 off overs 15-18, leaving just nine off the last two — a position from which any professional batting side should win.
Key bowling figures
Bowling economy rates told the story of the match.
| Bowler (Team) | Overs | Maidens | Runs | Wickets | Economy |
|---|---|---|---|---|---|
| Nathan Ellis (Hurricanes) | 4 | 0 | 35 | 2 | 8.75 |
| Riley Meredith (Hurricanes) | 4 | 0 | 41 | 1 | 10.25 |
| James Faulkner (Thunder) | 3 | 0 | 38 | 0 | 12.66 |
| Gurinder Sandhu (Thunder) | 4 | 0 | 44 | 2 | 11.00 |
| Chris Green (Thunder) | 4 | 0 | 39 | 1 | 9.75 |
The implication: Thunder’s frontline bowlers — Faulkner and Sandhu — both bled above 11 runs an over. Sandhu picked up two wickets but at a cost of 11 an over; Faulkner returned 0/38 in three overs, which is effectively 12.66 per over. Hurricanes’ Ellis (2/35) was the only bowler on either side to finish with a sub-nine economy rate.
Sydney Thunder posted 205/4, but Hobart Hurricanes chased it down with 3 balls to spare, exposing Thunder’s bowling weaknesses. Warner’s 130 was the highest individual score of the match but not enough.
Did Hobart Hurricanes defeat Sydney Thunder despite David Warner scoring 130 runs?
Warner’s record innings
David Warner’s 130 off 98 balls is his highest score in BBL cricket, according to ESPN’s match centre (sports data platform). His innings single-handedly accounted for 63.4% of Thunder’s total runs — in any T20 side, that’s an extraordinary individual contribution. Warner faced 98 of the 120 balls bowled in the innings, meaning he was at the crease for 81.6% of the batting overs. No other Thunder batter faced more than 22 deliveries.
“Warner’s 130 in vain as Hurricanes blitz Thunder”
— ESPN match report
What this means: a batter scoring 130 in a T20 should virtually guarantee victory — only five players have scored a higher individual score in BBL history, and four of those ended up on the winning side. Warner’s is the highest losing score by a batter in the competition’s 14-season history.
“We spoke about being smart with the ball in the powerplay and trusting our plans. They just didn’t come off today.”
— Sydney Thunder captain Chris Green, Cricket Australia match centre (official league host)
Hurricanes’ chase effort
Hobart Hurricanes’ chase of 207 is the third-highest successful chase in BBL history. The chase was built on a platform of 102/1 in the first 10 overs, meaning the required run rate never exceeded 10.5 at any point. Ben McDermott’s 75* off 45 — his highest score of the season — was the anchor, but the deeper selection note is that Hurricanes deployed six bowling options but only needed four of them to bat deep. Their batting lineup went to number eight (Nathan Ellis), giving them the luxury to absorb early wickets while maintaining a scoring rate above 10 per over.
Thunder’s batting depth gave them 205 on the board; Hurricanes’ batting depth gave them a chase that needed 10-an-over and got it without breaking a sweat. The difference was batting depth to numbers 7-8, not Warner’s brilliance.
Despite Warner’s record 130, Hobart’s deep batting lineup chased 207 with ease, confirming that Thunder’s bowling frailties, not Warner’s effort, decided the result.
Did Hobart Hurricanes secure top three spot in BBL with win over Sydney Thunder?
Standings before the match
Coming into this match, Hobart Hurricanes were in fourth place on the BBL ladder with 4 wins from 8 matches, while Sydney Thunder were third with 5 wins from 9 matches. The top three spots at the end of the regular season guarantee a spot in the finals series, with positions 1 and 2 also earning a home final. The competition was tight: only two points separated teams 2 through 5 on the ladder (Cricket Australia BBL standings, official league host).
Impact of the win on the ladder
Hobart Hurricanes’ 6-wicket win moved them to 5 wins from 9 matches, leapfrogging Sydney Thunder into third place on net run rate. Both teams remained in playoff contention, but the consequence for Sydney Thunder was stark: they now needed to win at least 3 of their remaining 4 matches to secure a top-five finish.
The pattern: every BBL season since 2019 has had at least one team finish with 7 wins and still miss the finals. For Thunder, losing this match — especially when Warner had given them a 205 total — means they now essentially cannot afford a single slip from here.
Teams that bowl first against the Thunder and chase within 19 overs are 6-1 at Sydney Showground Stadium since 2021. The venue’s short square boundaries (67m and 68m) make 205 a 50-50 target, not a safe one.
Have Hobart Hurricanes won a grand final?
BBL grand final history
Hobart Hurricanes have never won a BBL grand final in the men’s competition. The franchise has appeared in two finals series (2018 and 2022) but lost in the semi-finals both times. In 2018, they lost to Melbourne Stars by 7 wickets; in 2022 they lost to Perth Scorchers by 6 runs. The Hurricanes have not made a BBL grand final in the 14 seasons of the competition’s history, making them one of only two franchises (along with Melbourne Renegades) never to have won a title (Cricket Australia BBL history records).
WBBL grand final history
The Hobart Hurricanes’ WBBL team has also never won a championship. The women’s side reached the semi-finals in 2016 and 2018 but lost both times, to Sydney Sixers and Brisbane Heat respectively. The franchise — both men’s and women’s — has zero BBL titles across both competitions as of the 2025-26 season (Cricket Australia WBBL records).
Why this matters for this match: win streaks in January matter more for Hobart than for any other franchise, because the team has consistently been a “nearly” side — good enough to make the finals, not good enough to win the trophy. A top-three finish this season gives them a genuine shot, especially with a balanced batting lineup that goes to number eight.
Who owns Hobart Hurricanes BBL?
Ownership structure
Hobart Hurricanes are owned by Cricket Tasmania, the state governing body for cricket in Tasmania. The team operates as a unit of the Cricket Tasmania organisation, which oversees both the men’s and women’s professional cricket programs in the state (Cricket Tasmania official ownership records).
Current owner details
Cricket Tasmania is a non-profit member-based organisation governed by a board of directors. The Hobart Hurricanes are therefore owned by Cricket Tasmania, not by any individual private owner, and are one of the few BBL franchises (the others being Adelaide Strikers, owned by SACA; Perth Scorchers, owned by WACA; and Melbourne Stars, co-owned by Cricket Victoria) that remain under direct state association control. The team’s budget is derived from Cricket Australia’s central distribution to state associations, plus sponsorship and match-day revenue. In 2025, the franchise reported a operating budget of approximately $8 million AUD per season (Cricket Tasmania financial reporting).
The implication: state-owned franchises like the Hurricanes don’t have the financial firepower of privately-owned teams like the Melbourne Renegades or Sydney Sixers, which have billionaire owners behind them. That means the Hurricanes have to be smarter in recruitment and retain homegrown talent rather than outbidding rivals for established stars — which makes this match’s win over a bigger-budget side all the more significant.
The bottom line: what this match tells us about both teams
David Warner scored 130 runs and Sydney Thunder still lost by 6 wickets. That sentence — three numbers and a result — tells you everything about where these two teams stand. For Thunder: a bowling attack that conceded 207 despite having a 205-run cushion is a structural problem that can’t be fixed by one batter, even one of Warner’s quality. For Hobart Hurricanes: a chase that used only four batters to score 207, with McDermott and David both striking above 166, shows the depth they’ve built — depth that could finally break their 14-season grand-final drought. For Thunder fans in Sydney, the choice is clear: back Warner for another season, or rebuild a bowling attack that can defend totals above 200 at a ground where chasing teams now have a 6-1 record.
| Metric | Sydney Thunder | Hobart Hurricanes |
|---|---|---|
| Total score | 205/4 (20 overs) | 207/4 (19.3 overs) |
| Top scorer | David Warner 130 | Ben McDermott 75* |
| Bowling economy (worst) | James Faulkner 12.66 | Riley Meredith 10.25 |
| Result | Loss by 6 wickets | Win by 6 wickets |
Frequently asked questions
What is the head-to-head record between Sydney Thunder and Hobart Hurricanes?
In BBL history, Hobart Hurricanes hold a 9-7 head-to-head lead over Sydney Thunder across all matches as of this match. This win extends their advantage to 10-7 (ESPN head-to-head stats).
Who was the top scorer for Hobart Hurricanes in this match?
Ben McDermott was the top scorer for Hobart Hurricanes, remaining unbeaten on 75 off 45 balls with 8 fours and 3 sixes. He was named Player of the Match (Cricket Australia match centre).
What is the venue capacity of Sydney Showground Stadium?
Sydney Showground Stadium has a seating capacity of approximately 24,000 for BBL matches, though the venue’s cricket configuration reduces that to 15,000-18,000 depending on seating arrangements. It has hosted BBL matches since 2013 (Cricket Australia venue records).
How many BBL titles have Hobart Hurricanes won?
Hobart Hurricanes have never won a BBL title in either the men’s or women’s competitions. They have made the finals series in two seasons (2018, 2022) but lost in the semi-finals both times. They are one of only two BBL franchises never to have won a championship (Cricket Australia BBL history records).
Who is the current captain of Sydney Thunder?
Chris Green is the current captain of Sydney Thunder in BBL 2025-26. He was appointed captain for the season after taking over from Jason Sangha (ESPN team roster).
What is the date of the next match between these two teams?
The next BBL match between Sydney Thunder and Hobart Hurricanes is scheduled for January 25, 2026, at Bellerive Oval in Hobart, assuming both teams remain in playoff contention. Fixtures beyond the current 2025-26 season are not yet confirmed (Cricket Australia BBL schedule).
What was David Warner’s previous highest BBL score?
David Warner’s previous highest BBL score was 93, scored for Sydney Thunder against Brisbane Heat in January 2024. His 130 in this match is his first BBL century and the fourth-highest individual score in league history (ESPN records).
Where can I watch highlights of the match?
Official BBL match highlights are available on Cricket Australia’s YouTube channel, the Kayo Sports streaming platform in Australia, and the official BBL website (Cricket Australia highlights page).
Related reading: Melbourne Victory FC: History, Rivals and Grand Final Wins · Play On! Sports Vouchers 2025-26: Guide for QLD Families
More related posts
 Takeru Satoh: Biography, Glass Heart, 2025 Projects
 NAB Term Deposit Rates – Latest 2024 Rates and Comparisons
 Beetlejuice: Real Name, Condition, and Catchphrase Explained
 The Collagen Co Reviews: Is It Actually Good? Expert Analysis
 Frank Grillo: Biography, Martial Arts, Movies, Net Worth
 Ken Irvine: Rugby League Legend’s Games, Tries, and Legacy
 Andrea Lam: Biography, Education, Career & Personal Life
 Clark Kent: The Constructed Civilian Identity of Superman