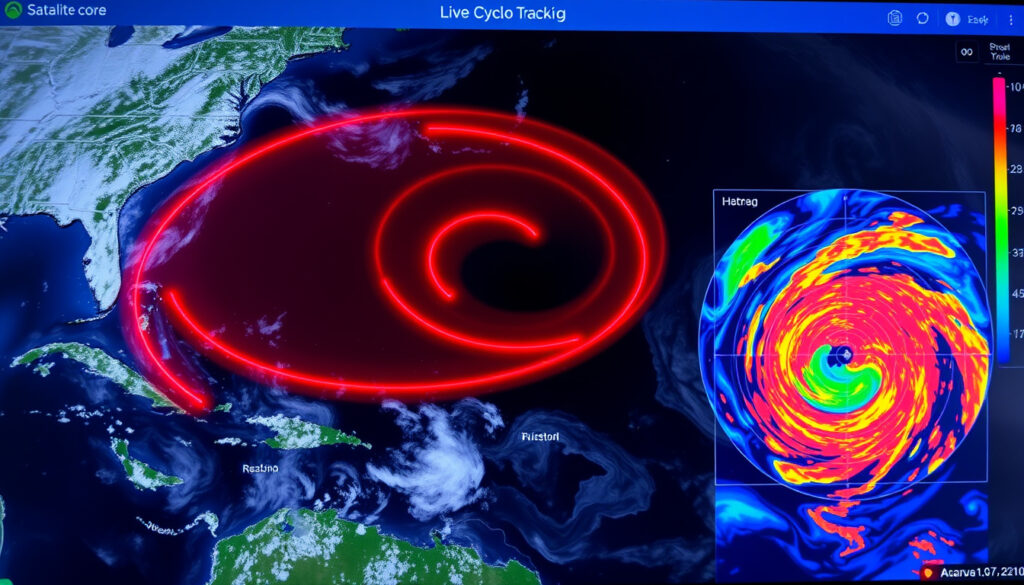
Live Cyclone Tracker Map: Real-Time Storm Paths & Satellite
Watching a hurricane spin toward land from orbit can be almost hypnotic—the curved arms of cloud wrapping around an eye tens of miles wide. But that same visual power lulls people into passive spectatorship when they should be preparing. A live cyclone tracker map puts real-time data in your hands: where the storm is right now, where it’s likely to go, and what the next few days could mean for communities in its path.
Annual Tropical Cyclones: 80-90 worldwide · Top Live Maps: 5 interactive sites · Forecast Updates: Every 3 hours · Coverage: Global wind, ocean, satellite · Tracking Tools: Radar, satellite imagery
Quick snapshot
- Zoom Earth updates satellite images every 10 minutes with a delay between 20 and 40 minutes (Google Play Store – Zoom Earth)
- NRL’s Marine Meteorology Division makes 45-day cyclone forecasts four times daily (Naval Research Laboratory)
- Exact current cyclone locations without checking live trackers directly
- Regional tracking coverage differences between Northern and Southern Hemisphere basins
- AI models like Climavision’s Horizon AI Global are outperforming traditional forecast systems, predicting landfalls up to nine days in advance (Climavision)
- Hyper-local forecasts down to 0.67 km resolution now possible with next-generation weather models (Climavision)
These five interactive platforms aggregate global cyclone data into viewable maps.
| Field | Value |
|---|---|
| Primary Trackers | zoom.earth, windy.com |
| Update Frequency | Every 3 hours |
| Features | Satellite, radar, wind forecasts |
| Global Scope | Hurricanes, cyclones, typhoons |
| Satellite Sources | NOAA GOES, EUMETSAT Meteosat, JMA Himawari |
| Radar Network (U.S.) | 158 Doppler stations |
How do you track a cyclone?
Modern cyclone tracking combines satellite imagery, radar networks, and supercomputer model outputs into interactive maps that update in near real-time. The best free tools stitch together data from multiple government agencies and research institutions so you can see the full picture without specialized software.
Using live satellite maps
- Open Zoom Earth and select the hurricane or cyclone layer from the map controls. The platform pulls live imagery from NOAA GOES, EUMETSAT Meteosat, and JMA Himawari geostationary satellites.
- Zoom Earth overlays tropical system tracks using data from the National Hurricane Center (NHC), Joint Typhoon Warning Center (JTWC), Naval Research Laboratory (NRL), and IBTrACS international database.
- Satellite images update every 10 minutes, though there’s a 20-40 minute processing delay before they’re visible on the map.
- For wind pattern visualization, Earth Nullschool displays supercomputer forecast data every three hours on an animated globe.
Forecast models from WMO
The World Meteorological Organization coordinates global forecasting standards, but the actual predictions come from national agencies running specialized models. The NRL Marine Meteorology Division runs four forecasts daily for every cyclone worldwide, with COAMPS-TC providing five-day high-resolution predictions (Naval Research Laboratory). The Dvorak technique, developed from early satellite imagery, remains the primary method in most basins for estimating a storm’s maximum sustained winds from visible cloud patterns (Wikipedia).
Interactive radar tools
- The United States operates 158 Doppler radars across the country that detect precipitation intensity, wind speeds, and storm structure during landfall events (Climavision).
- Doppler technology, upgraded from 1990s-era systems, provides rainfall estimates and tornado locations within a storm’s spiral bands.
- Zoom Earth processes radar data in real-time from meteorological sources worldwide.
Where is there a cyclone happening right now?
Five major platforms aggregate real-time cyclone data into viewable global maps. Each has strengths depending on whether you need satellite visuals, wind patterns, or official forecast cone overlays.
Current tropical cyclone activity
- Zoom Earth shows active storms with hurricane tracker layers, rain maps, and heat spot overlays updated from NASA satellite data.
- Weather Underground aggregates NOAA/NESDIS and NHC imagery for hurricane tracking maps with five-day forecasts for tropical storms worldwide.
- HurricaneZone publishes cyclone bulletins and satellite imagery for global storm tracking.
Live global maps
- Earth Nullschool (earth.nullschool.net) displays wind, weather, ocean, and pollution conditions forecast by supercomputers on an interactive animated map updated every three hours.
- Zoom Earth combines geostationary satellite imagery (refreshed every 10 minutes) with polar-orbiting NASA data (updated twice daily) from Aqua and Terra satellites.
- Windy.com provides animated global maps with wind, waves, and radar overlays for storm forecasting.
MetService updates
Regional weather services like New Zealand’s MetService publish tropical cyclone activity reports for the Southwest Pacific. When a storm enters that basin, MetService bulletins become the authoritative local source alongside JTWC warnings for the broader Pacific region.
Where is Storm Amy going to hit?
Storm Amy reached Ireland and parts of the United Kingdom in early October 2025, marking one of the more notable European windstorm events of that year. Tracking such storms requires looking beyond Atlantic hurricane maps to European windstorm databases.
Storm path forecasts
- The Met Office (UK’s national weather service) issued detailed warnings for Storm Amy covering the period from 3 to 4 October 2025.
- European windstorms follow different naming conventions and forecasting protocols than tropical cyclones—they’re tracked by regional national weather services rather than the NHC.
Affected countries
Storm Amy’s track took it across Ireland and into parts of western Scotland and northern England, bringing sustained winds that prompted Met Office amber warnings in affected areas. Wikipedia maintains pages for notable European windstorms, including Storm Amy, that document affected regions and reported impacts.
Ireland impact
Ireland’s national weather service, Met Éireann, cooperates with the Met Office on cross-border storm warnings. When a named storm approaches, Irish residents should monitor Met Éireann bulletins alongside UK Met Office updates for the most relevant local forecasts.
Should you open windows in a cyclone?
This question comes up regularly in cyclone preparation guidance, and the answer from emergency management agencies is consistent: no. Opening windows during a cyclone creates an uneven pressure distribution inside your home that can cause structural damage.
Cyclone safety FAQs
- Don’t open windows: Tropical Cyclone Queensland’s official guidance states that opening windows allows wind to enter and create unpredictable pressure changes that can lift roofs or damage walls.
- Stay away from exterior walls and windows: During the storm’s most intense phase, the safest interior room is typically a small, windowless space on the lowest floor.
- Secure outdoor items before the storm: Lose objects like patio furniture become dangerous projectiles in sustained 100+ mph winds.
Home preparation tips
Before cyclone season, Queensland’s Get Ready campaign recommends checking that doors and windows close securely, trimming trees that could fall onto structures, and clearing gutters so heavy rain drains properly. If mandatory evacuations are ordered, leave well before storm conditions make travel dangerous.
The pressure differential myth—believing that opening a window on one side equalizes “explosive” pressure from the other—has been repeatedly debunked by structural engineers and emergency managers.
Should you stay upstairs or downstairs during a cyclone?
The answer depends primarily on flooding risk. In areas prone to storm surge or heavy rainfall flooding, the ground floor becomes dangerous even if the structure itself holds. Modern cyclone-rated homes may perform differently than older construction.
Home safety in cyclones
- If your area faces storm surge flooding, prioritize moving to the highest safe floor rather than staying at ground level.
- For tornadoes spawned by cyclones—which often accompany the outer rain bands—the safest spot is an interior room on the lowest floor without windows.
- Australia’s cyclone building standards recommend that newer homes be designed to remain standing in Category 4 winds, with occupants directed to an internal room.
Best shelter locations
White Pages safety guidance for cyclone-prone homes identifies the strongest interior room—typically a bathroom or closet without exterior walls—as the optimal shelter location. For multi-story homes, the ground floor interior room offers the best combination of wind protection and flood avoidance.
Residents in coastal areas face a hard choice when storm surge is forecast: ground-floor interior shelter may mean riding out flooding; upper-floor shelter may mean being in a more wind-exposed part of the structure.
Step-by-step: Using a live cyclone tracker map
Four tools give you comprehensive coverage. Here’s how to use them together for the most complete picture of any active storm.
- Open Zoom Earth: Navigate to zoom.earth and look for the hurricane icon in the map controls. Select “Hurricanes” to see active tropical cyclones worldwide overlaid on satellite imagery. Check the timestamp to confirm you’re viewing current data.
- Add wind pattern context: Open Earth Nullschool (earth.nullschool.net) in a second tab. Select the “Wind” layer and zoom to the storm region. This shows you the actual airflow driving the system—useful for understanding why a storm is tracking in a particular direction.
- Check official forecast cones: Visit the National Hurricane Center or Joint Typhoon Warning Center website to see the official forecast cone. This cone represents the probable track of the storm center, not the full area of impact, and includes five-day projections.
- Verify with Windy.com: Open Windy.com for radar overlays and animated forecasts. Toggle between wind, rain, and pressure layers to see how the storm structure is expected to evolve over the next 48-72 hours.
- Monitor for rapid changes: Set a reminder to recheck trackers every three to six hours. Intensity forecasts can shift meaningfully, especially when a storm is approaching land or undergoing an eye wall replacement cycle.
Satellite imagery shows you what the storm looks like now, but forecast models can disagree on where it goes next. During Hurricane Beryl in July 2024, AI models predicted the northeast turn days earlier than traditional systems (Climavision), but no single model is always right.
Confirmed
- Top trackers include zoom.earth, earth.nullschool.net, and Windy.com
- Satellite imagery updates range from every 10 minutes (geostationary) to twice daily (polar-orbiting)
- NRL’s COAMPS-TC system has provided five-day tropical cyclone predictions since 1997
- The United States operates 158 Doppler radars for precipitation and wind detection
- Climavision’s Horizon AI Global processes 1.5 billion observations daily
Unclear
- Exact real-time cyclone locations require checking live tools directly
- Regional coverage quality varies between Atlantic/Pacific basins versus Southern Hemisphere tracking networks
- Specific details on machine learning integration in proprietary forecast models beyond general descriptions
NRL has supported U.S. Navy military and humanitarian missions with global hurricane and typhoon information using COAMPS since 1997.
— Naval Research Laboratory, Marine Meteorology Division
Climavision’s Horizon AI Global outperformed GFS and ECMWF during major 2024 hurricanes like Beryl and Helene, accurately predicting landfalls up to nine days in advance.
— Climavision, Weather Intelligence Report
The shift toward AI-driven forecasting is already changing what five-day and even two-week projections can reliably show. Coastal communities benefit most from this technology, gaining hours of additional warning time compared to waiting for television weather reports—but that advantage only matters if you check the trackers before conditions deteriorate.
Where is storm Melissa going to hit?
Storm Melissa is a notable named winter storm, but current cyclone tracker maps focus on tropical systems. For extratropical storms, the National Weather Service and local forecast offices provide the most accurate track information for affected regions.
Where is cyclone Alfred expected to hit?
Cyclone Alfred affected parts of Australia in early March 2025. For active storms, Zoom Earth and the Australian Bureau of Meteorology provide real-time tracking and official forecast cones for affected coastal regions.
Will Storm Amy hit Ireland?
Storm Amy made landfall across Ireland and western UK on October 3-4, 2025. Met Éireann and the UK Met Office issued coordinated warnings for this event, with wind speeds warranting amber alerts in multiple counties.
What countries will Storm Amy hit?
Based on Met Office and Met Éireann records, Storm Amy impacted Ireland and the United Kingdom, with the strongest effects in coastal and western regions of both countries.
What is the 30 minute thunder rule?
The 30-30 rule for lightning safety suggests that if the time between lightning and thunder is 30 seconds or less (meaning the storm is within 6 miles), all outdoor activities should stop. People should remain in sheltered locations for 30 minutes after the last thunder clap before resuming activities.
How accurate are live cyclone trackers?
Official forecast cones from the National Hurricane Center represent a 66% probability circle for the storm center at each time point. Satellite imagery shows current storm structure accurately, but track forecasts become less reliable beyond five days. AI models like Climavision’s Horizon AI Global reportedly predicted landfalls nine days in advance during 2024 hurricanes.
What satellite views show cyclones best?
Geostationary satellites (NOAA GOES, EUMETSAT Meteosat, JMA Himawari) provide continuous coverage and are best for tracking storm movement in real-time. Polar-orbiting satellites like NASA’s Aqua and Terra offer higher-resolution imagery but pass the same location only twice daily. For storm intensity estimation, the Dvorak technique uses visible and infrared imagery from geostationary platforms.
Related reading: live status maps
weather.ndc.nasa.gov, gfdl.noaa.gov, accuweather.com, dl.acm.org, radar.weather.gov
Tools like those on Zoom Earth shone during Cyclone Alfred, where the Cyclone Alfred live tracker offered precise BOM maps and path forecasts for safety.
More related posts
 Hells Angels Membership, Patches, and Rules Explained
 Art Gallery NSW: Guide to Visiting, Tickets & Highlights
 Advent Calendar Guide: History, Contents & Rules
 Preslee Faith: Age, Bio, Religion, and TikTok Fame
 Emma Corrin: LGBTQ Identity, Relationship, Binders & Career
 Britt Robertson: Relationships, Career, and Julia Roberts Rumor
 Sam Walker Biography: Injury, Partner, Net Worth, Age
 Barbie Doll Value: Are They Worth Money? (2026 Guide)